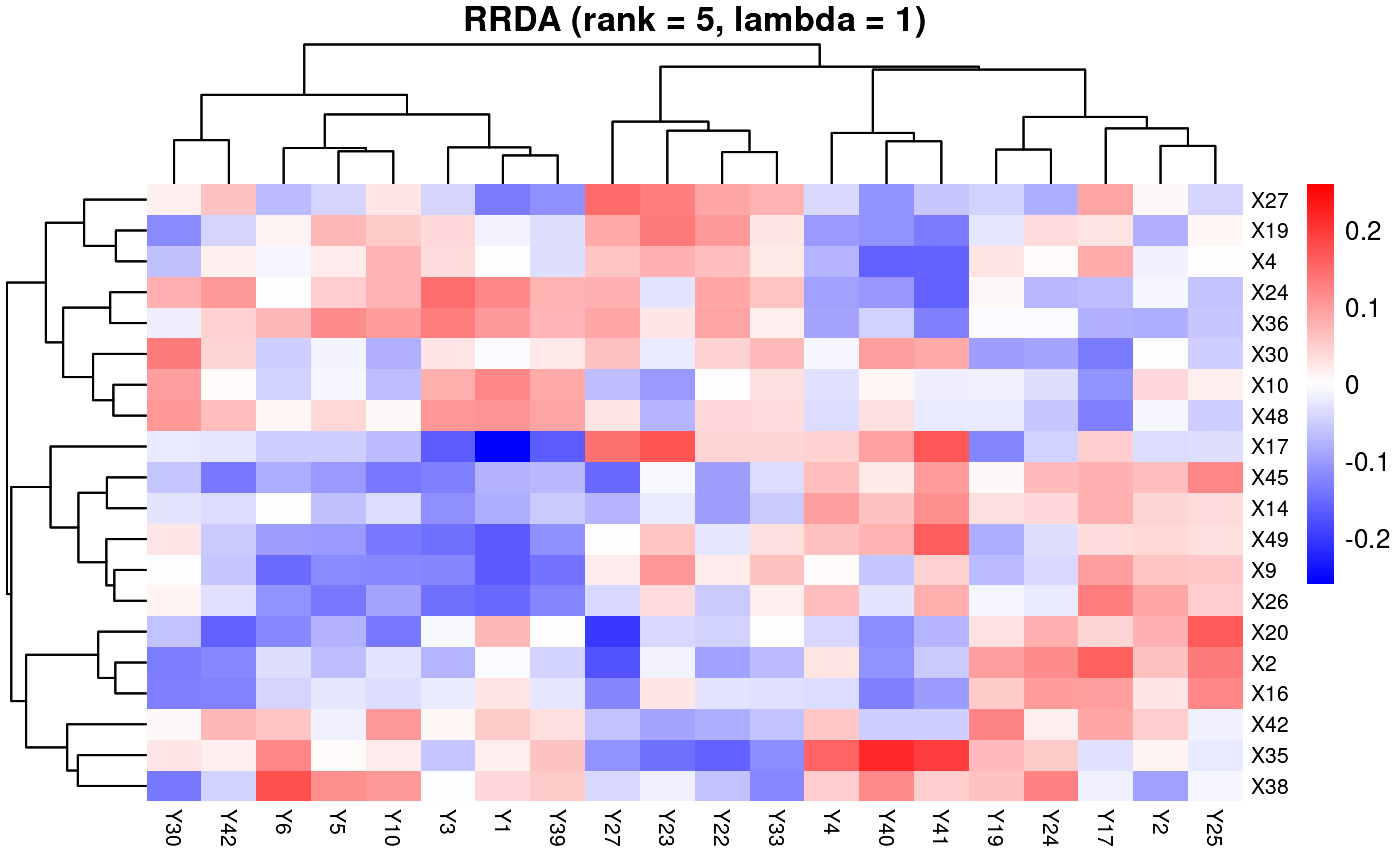
Top feature interactions visualization with rank and lambda penalty
rrda.top.RdVisualizes the most influential feature interactions (based on the L2 norm) from Ridge Redundancy Analysis (RRDA) as a heatmap.
Let the (rank-\(r\) truncated) decomposition of \(\hat{B}(\lambda)\) be $$\hat{B}(\lambda, r) = U_{\hat{B}(\lambda)} \, D_{\hat{B}(\lambda)} \, V_{\hat{B}(\lambda)}^{\prime}.$$
The following three biplot scalings are defined:
Symmetric scaling (default): $$\tilde{F} = U_{\hat{B}(\lambda)} \, D_{\hat{B}(\lambda)}^{1/2}, \qquad \tilde{G} = V_{\hat{B}(\lambda)} \, D_{\hat{B}(\lambda)}^{1/2}.$$
X scaling: $$\tilde{F} = U_{\hat{B}(\lambda)} \, D_{\hat{B}(\lambda)}, \qquad \tilde{G} = V_{\hat{B}(\lambda)}.$$
Y scaling: $$\tilde{F} = U_{\hat{B}(\lambda)}, \qquad \tilde{G} = V_{\hat{B}(\lambda)} \, D_{\hat{B}(\lambda)}.$$
In all three cases, \(\hat{B}(\lambda, r) = \tilde{F} \, \tilde{G}^{\prime}.\)
Variable importance is scored by the row-wise \(\ell_2\)-norms: $$s_i^{(\tilde{F})} = \| \tilde{F}_{i,\cdot} \|_2, \qquad s_j^{(\tilde{G})} = \| \tilde{G}_{j,\cdot} \|_2.$$
Selecting the top \(m_x\) predictors and \(m_y\) responses yields the submatrices of the scaled factor matrices (each with \(r\) columns).
The reduced coefficient submatrix is then $$\hat{B}_{\mathrm{sub}}(\lambda, r) = \tilde{F}_{\mathrm{sub}} \, \tilde{G}_{\mathrm{sub}}^{\prime}.$$
The matrix \(\hat{B}_{\mathrm{sub}}(\lambda, r)\) retains the dominant low-rank structure and is visualized as a heatmap (with \(m_x = m_y = 20\) by default).
Usage
rrda.top(
  Y,
  X,
  nrank = NULL,
  lambda = NULL,
  mx = 20,
  my = 20,
  scaling = c("symmetric", "none", "x", "y"),
  title = TRUE
)
Arguments
- Y
A numeric matrix of response variables.
- X
A numeric matrix of explanatory variables.
- nrank
Integer rank \(r\) of \(\hat{B}\) to visualize. If
NULL(default), it is set tomin(5, min(dim(X), dim(Y))).- lambda
A numeric vector of ridge penalty values. If
NULL(default), it is set to 1.- mx
Integer; number of top \(X\)-features (predictors) to display. Defaults to
20.- my
Integer; number of top \(Y\)-features (responses) to display. Defaults to
20.- scaling
Character string specifying how to apply the singular values from the compositions of \(\hat{B}(\lambda)\) when constructing the biplot factors. Options are:
"symmetric"(default) distributes singular values evenly to both sides (balanced scaling),"x"applies them fully to the X (left) side,"y"applies them fully to the Y (right) side, and"none"removes them (no singular value weighting).- title
Figure title. If
TRUE(default), a formatted title is used. IfFALSEorNULL, no title is drawn. If a single string, it is passed through to the figure title.
Value
A list with elements: heatmap (pheatmap object), B_sub (mx x my matrix), top_x, top_y, b1_sub, b2_sub, fit, scaling.
Examples
set.seed(10)
simdata<-rdasim1(n = 10,p = 50,q = 50,k = 3) # data generation
X <- simdata$X
Y <- simdata$Y
rrda.top(Y=Y,X=X,nrank=5,lambda=1,mx=20,my=20)


if (FALSE) { # \dontrun{
### In practice, the parameters nrank and lambda should be selected by CV ###
cv_result<- rrda.cv(Y = Y, X = X, maxrank = 5, nfold = 5) # cv
best_lambda<-cv_result$opt_min$lambda
best_rank<-cv_result$opt_min$rank
rrda.summary(cv_result = cv_result)

rrda.top(Y=Y,X=X,nrank=best_rank,lambda=best_lambda,mx=20,my=20)
} # }
if (FALSE) { # \dontrun{
### In practice, the parameters nrank and lambda should be selected by CV ###
cv_result<- rrda.cv(Y = Y, X = X, maxrank = 5, nfold = 5) # cv
best_lambda<-cv_result$opt_min$lambda
best_rank<-cv_result$opt_min$rank
rrda.summary(cv_result = cv_result)
rrda.top(Y=Y,X=X,nrank=best_rank,lambda=best_lambda,mx=20,my=20)
} # }